After the June 2017 General Election, can we see a new class coalition emerging?
The shock gains by Corbyn have gifted him a political, if not electoral, victory. In light of this there has been a rush to try to understand how this happened despite his long-term problems in the polls, and political science’s incapacity to understand how left economics and an atypical media strategy fits into the current political landscape.
Though a lot of pundits have tried to frame this as a gain made due to an almost metaphysical opposition to the Tories, some political scientists have recognised correctly that these gains were built on something partially novel. This consists of a unique capacity for Corbyn to increase youth turnout and maintain left-wing support in a way which both counteracted the loss of the pro-Brexit portion of the culturally working class to the Tories and added a surprising set of new voters across several key seats.
This reflects the debate throughout Corbyn’s leadership, which has focused on which components of the Labour vote he is losing: those with lower education who voted for Brexit, the culturally defined C2DE “working class”, traditional older Labour voters, and so on. However, beyond a general sense that he is gaining the youth vote and a barrage of abuse based on class signifiers accusing supporters of being richer and more educated than historical Labour voters, a discussion of the class coalition he may actually represent has been severely lacking and replaced with a relatively vague focus on age.
In part this derives from a lack of debate on the changing political economy after the crisis, which is still largely being treated as a suspension of normal capitalism rather than part of capitalism’s long-term evolution. Though not addressed in full here, what’s important to identify here is a low-productivity Britain with a growth in high skilled young workers, alongside decades of high wealth growth among large sections of the population, all of whom have been affected differently by the crisis and its aftermath.
In these circumstances, we should be expecting a realignment of class alliances, not just a repeat of New Labour’s historical alliance of poorer culturally working-class voters, and educated culturally middle-class voters.
Currently, it’s difficult to ascertain if this did occur in the recent election. The data we have for 2017 is still limited. We have the election results and we have a breadth of increasingly outdated geographical data mixing the 2011 census with labour surveys from 2016 which allow us to at least capture the “spirit” of a seat even if we so far do not understand which actual voters moved to different parties.
Therefore, in this piece I will be first identifying what geographical trends we can identify from our data on 2017 but also, more fundamentally, looking back at data from earlier in Corbyn’s leadership to see if we could identify a new class coalition emerging.
To do so I focus on economic location as the primary component of class, as described in Marxist theory. This contrasts to the typical definition used, which drawing on Weberian analysis, focuses on how specific life attitudes are generated through the mediation of the skills and outcomes of specific occupations with only a peripheral relationship to these occupations place within capitalism as a whole. Focusing on economic location allows a more direct examination of the circumstances people find themselves in now, and in turn ties to what we have seen historic class alliances being built upon, and the production of associated cultural views. This is in contrast to the typical definition of class which derives people’s views from specific life attitudes generated through the mediation of skills and outcomes of specific occupations, with only a peripheral relationship to these occupations’ place within capitalism as a whole.
However, this can come with problems. The drive behind people’s voting intentions often reflects their entire life path and their values, which have been generated both in relation to their own lives and their social status. Nevertheless, it prevents the highly problematic tendency for ‘working class voters’ to be associated with specific norms of certain historical periods of capitalism and allows us to move beyond the bizarre idea that the working class is somehow shrinking as deindustrialisation sets in despite income and wealth inequalities remaining high and stagnant for decades.
What happened in 2017?
In this section I want to identify four key points from the geographical data we have on 2017 which, though not a comprehensive picture, highlights some interesting potential areas of economic location, and how these interact with typical ideas about peoples voting intentions. The geographical data is based on each constituency; and due to limited data from Scotland, only includes seats in England and Wales.
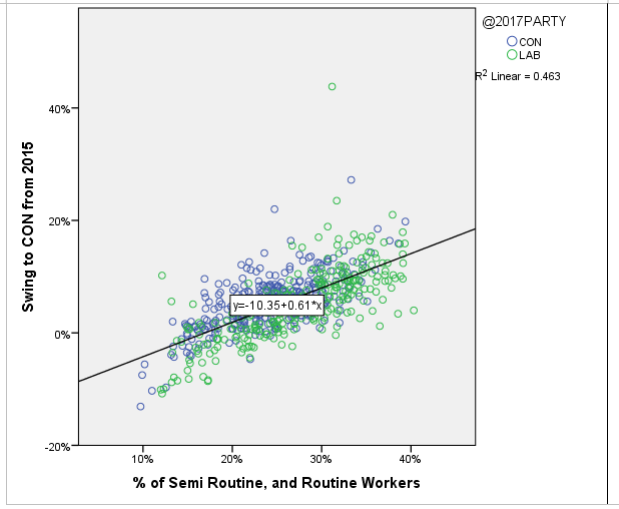
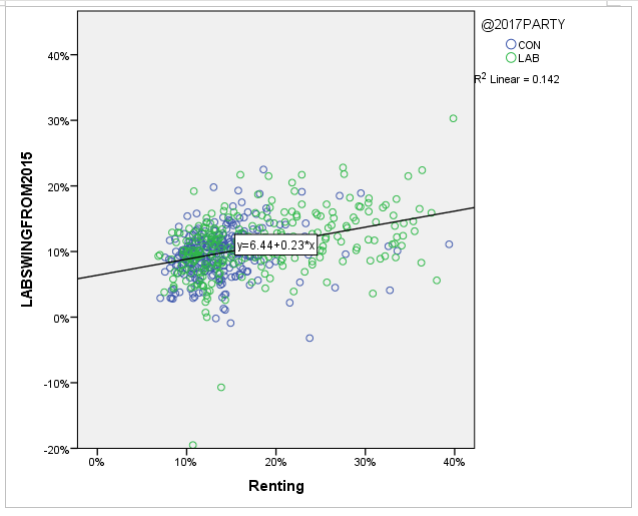
Throughout I will be focusing on the swing of the vote from 2015 to 2017 to identify where additional voters may be coming from, and will be colour coding each side by the winning Party in 2017 to highlight who is winning in seats where these swings are occurring. Each graph has a fit line, with the R2 identifying the degree of correlation between the two variables.
Firstly, the Tories did gain strong swings in seats with a high proportion of culturally working-class voters, represented by the semi-routine and routine occupations: the traditional “C2D” working class. In spite of this swing, they still didn’t win many seats with a higher proportion of these occupations.
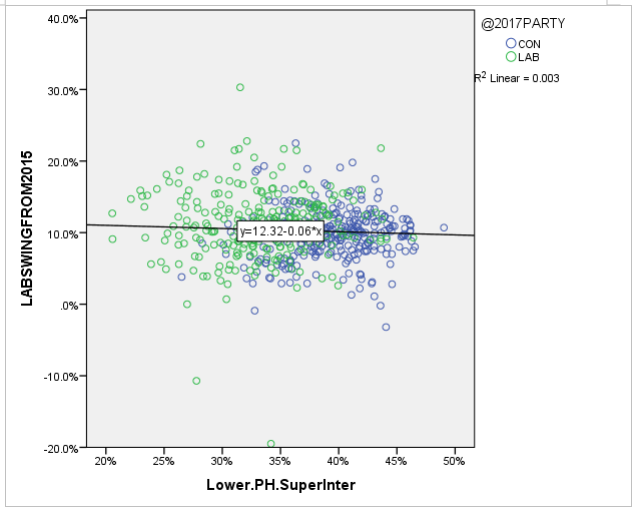
Furthermore, the Labour Party didn’t do well compared to 2015 in seats with a higher proportion of culturally middle-class occupations represented by lower professionals, “intermediate” occupations (including many low-skill office roles), and higher supervisors, with Tories still winning in many more middle class seats.
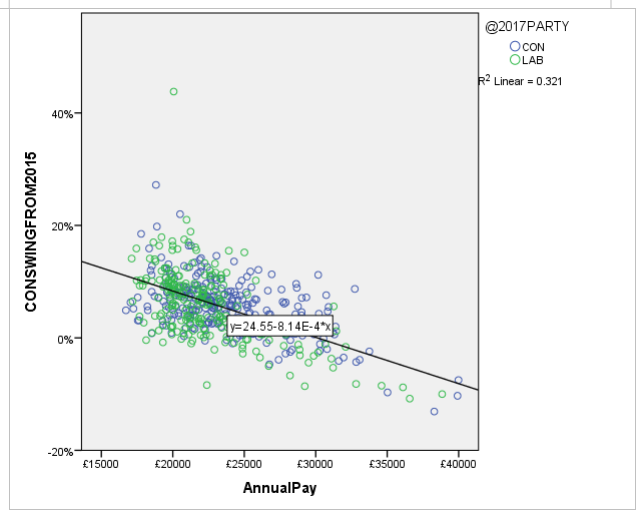
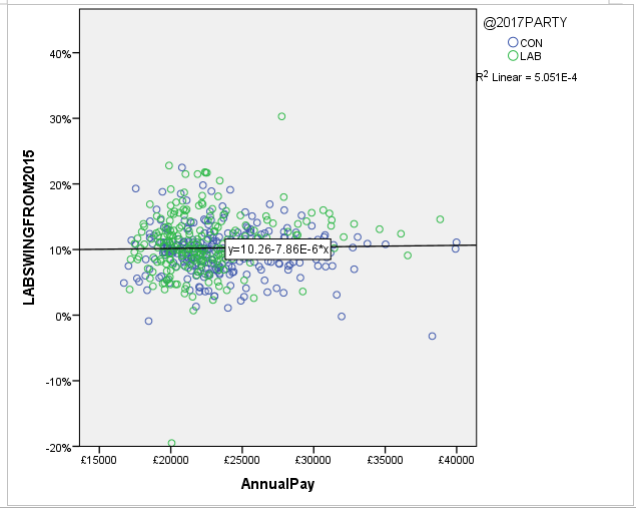
Secondly, a similar bifurcation exists in pay. The Tories did well compared to 2015 in areas with relatively lower median annual incomes despite failing to win many poorer seats. In turn no clear relationship exists between swings towards Labour and annual pay despite their continuing to win many poorer seats.
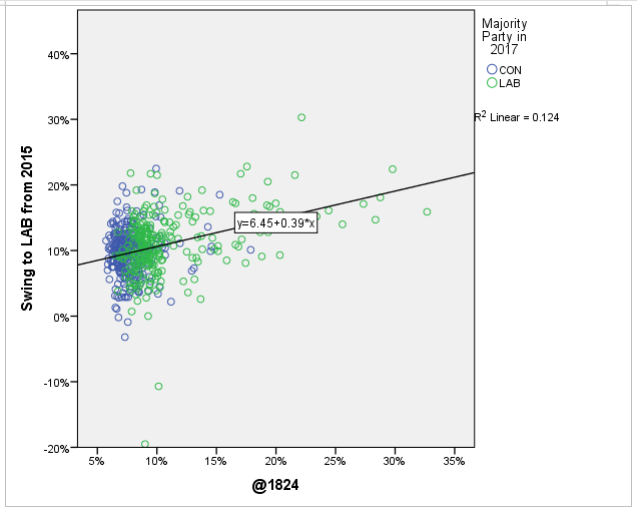
These two categories don’t do much to explain the Labour swing. Looking at the largely well supported view that young people helped drive Labour, we find clear evidence that they supported Labour’s swing, with Labour having higher swings and winning many seats with a higher percentage of 18-24s.
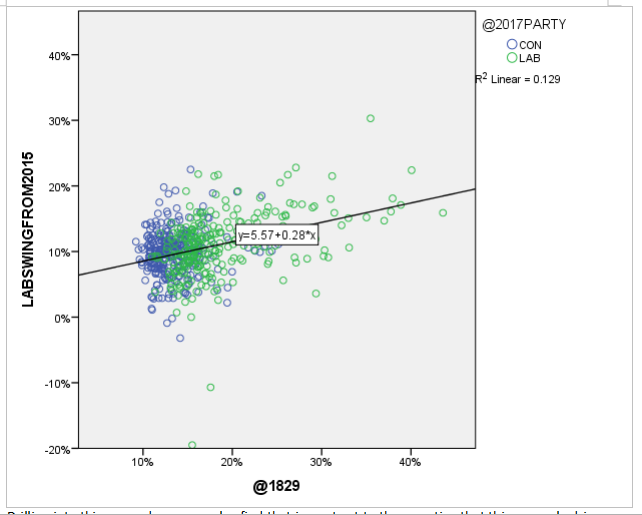
This isn’t the full story however, as although 18-24s were important, this trend becomes stronger if we extend it to include 18-29s. The R2 correlation is higher and as such seems to represent the full width of the recession generation, including those who reached the age of majority during and not long before the crisis hit.
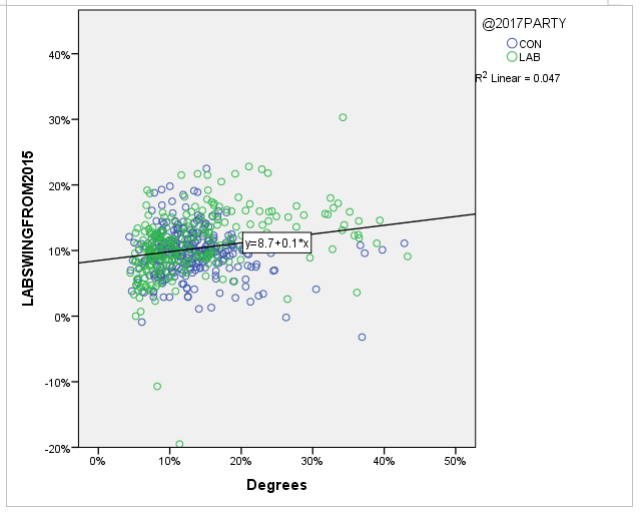
Drilling into this group deeper we also find that in contrast to the narrative that this was only driven by students and the educated young more generally, the role of the proportion of individuals with a degree in a constituency is weaker than the role of the proportion of households renting. This suggests a more directly economic cause.
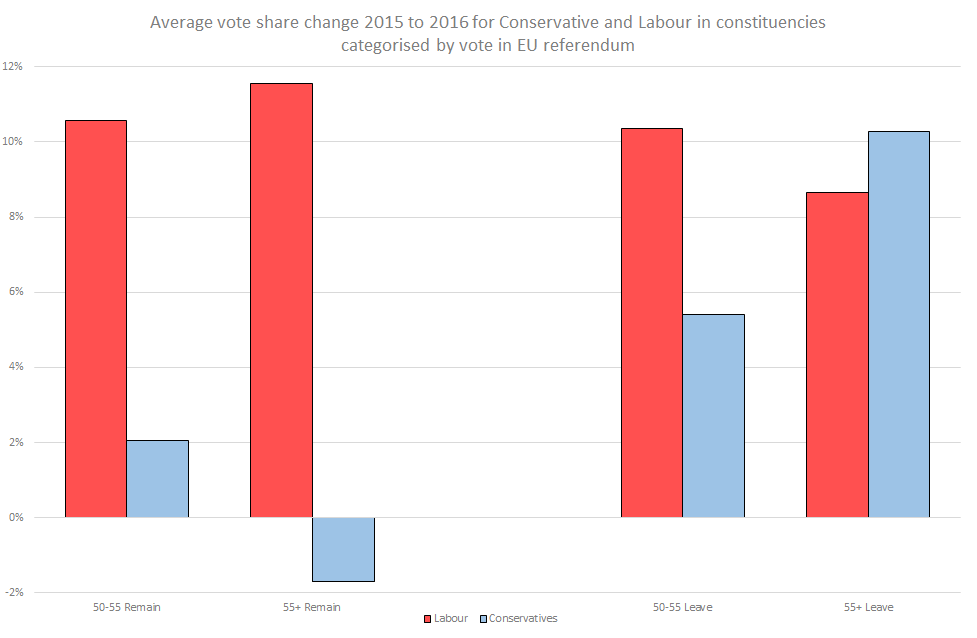
Finally, the role of the EU referendum is remarkably different for Labour and the Tories. Labour apparently had the capacity to maintain relatively high swings across all types of seats, defending many of its northern pro-Leave seats, with losses in strong pro-Leave seats matched by gains in strong pro-Remain seats. By contrast, the Tories faced significant disadvantages in strong-Remain seats and faced relatively small gains in both slightly pro-Remain and weak pro-Leave seats.
The overall picture that develops from this analysis is that, in many ways, each Party seems to have been fighting a different election.
The Tories appeared to believe the gains they could make in culturally working class and low-income seats would allow them to triangulate between their traditionally more middle class high income core vote and a share of Labour’s vote; in reality only a relatively small portion of the votes of the latter were lost. Labour was able to gain significant shares of new young voters and maintain key parts of the working class and low-income vote by focusing on left-wing policies.
Individual Voter Data, The Measures, and Initial Problems
In the absence of individual voter data from the post-election period, the rest of this article will focus on data from the tenth wave of the British Election Studies Internet Panel. This was collected in late 2016, at a time when Corbyn was at a low point in the polls, after the EU vote had affected support for Labour among both the lower educated due to their support for Leave and sections of the highly educated who were unhappy with their acquiescence to the referendum result.
To get a sense of economic location I will be looking at three measures: housing tenure as a representative of wealth, household income as a representative of an individual’s concrete available resources, and education as a representative of skill.
These cross the traditional ABC measures of social class in which education is largely the defining factor, due to its relationship with skill and therefore occupation. It also regards income as secondary due to old assumptions about the outcome of education, despite the growing numbers of poorer highly educated workers, and leaves wealth entirely out of the picture despite the rapidly growing generational gap.
The Changing Economic Location of Labour Voters from 2005 to 2016
The first comparison I want to make is between the three variables for economic location for Labour and Conservative voters between 2005 and 2016. Though the percentages include all parties, I am only presenting Labour and Conservative voters to provide a clear picture of the specific support among each group, and to identify changing patterns:
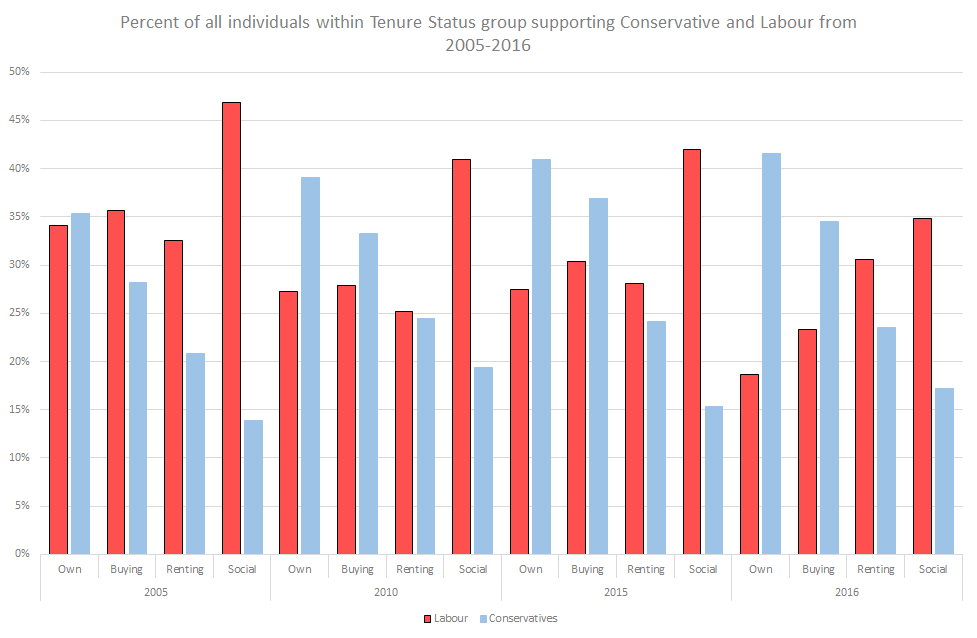
2016 represented a major shift away from traditional voting patterns for Labour among non-social tenants, while Conservative voting patterns had remained remarkably stable. Specifically, while non-social tenants had previously tended to each maintain relatively similar sized pro-Labour contingents, by 2016 a clear division between owners, buyers, and renters appeared. The contingent of renters in particular in 2016 supported Labour at levels closer to 2005 than 2010 or 2015.
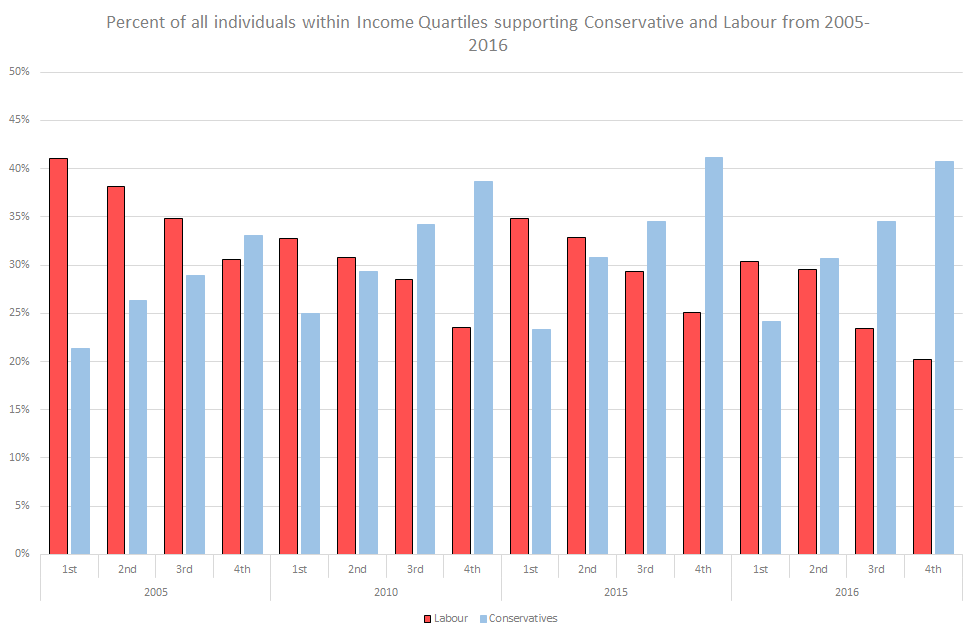
Income patterns again saw the Conservative voting pattern remain remarkably stable. In turn Labour’s share of each income quartile had become bifurcated in a way which put Labour in a disadvantageous position: typically with the 1st quartile converging with the 2nd in their support for Labour, and the 3rd converging with the 4th in higher support for the Conservatives. Alongside consistent Conservative voting patterns, this meant Labour lost all but the 1st income quartile.
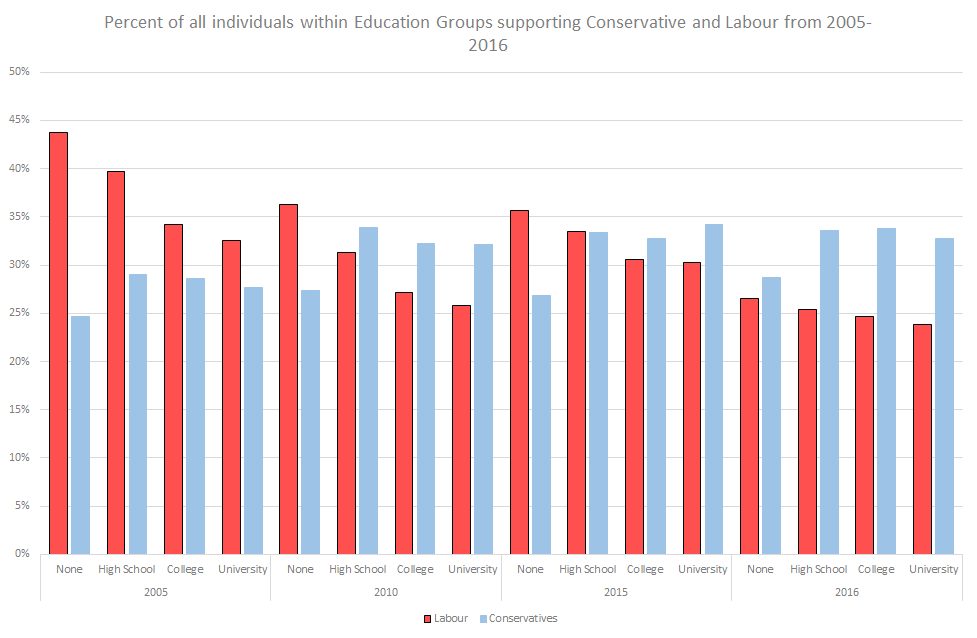
Finally, the patterns of support divided by education had remained relatively stable even as the gaps between each group had slowly converged. The large differences for Labour got closer from 2005, resulting in a rapid loss of support among those with no education despite no strong gains for Conservatives among this group.
Though throughout these graphs we can also see a generalised loss of Labour support in 2016, the changing patterns of support is significant in identifying:
- The changing role of wealth with lack of access to this (represented here as rental tenants) as the only constituency in which Labour was gaining.
- The bifurcation of support by income, with Labour retaining a smaller but still significant section of the poorer voters while richer voters become increasingly anti-Labour.
- The diminishment of educational differences as a predictor of vote share despite those with no education not clearly moving to the Conservatives either.
To a substantial extent this matches some of the initial assumptions made at the start of this piece. The decreased significance of education would be representative of a loss among low skilled workers; however the increasing bifurcation of education also shows that this didn’t represent a wholesale abandonment of Labour by the working class. While certainly some low skilled and poor workers are moving away from Labour, particularly in the 1st income quartile, a division by income remains strong and is increasingly supplemented by a division over wealth.
Uneven Losses from 2015 or a New Coalition of Voters?
The next three graphs will present information on the changing position of 2015 voters both to and from Labour in their 2016 voting intention, to indicate if this is actually a developing class interest or if it simply represents an uneven set of losses among those who voted for Labour in the past. Throughout it will utilise “other” rather than the Conservatives due to the limitations of presenting data on all major parties in an easy to read fashion, though in doing so it may disguise the various reasons people move away from Labour:
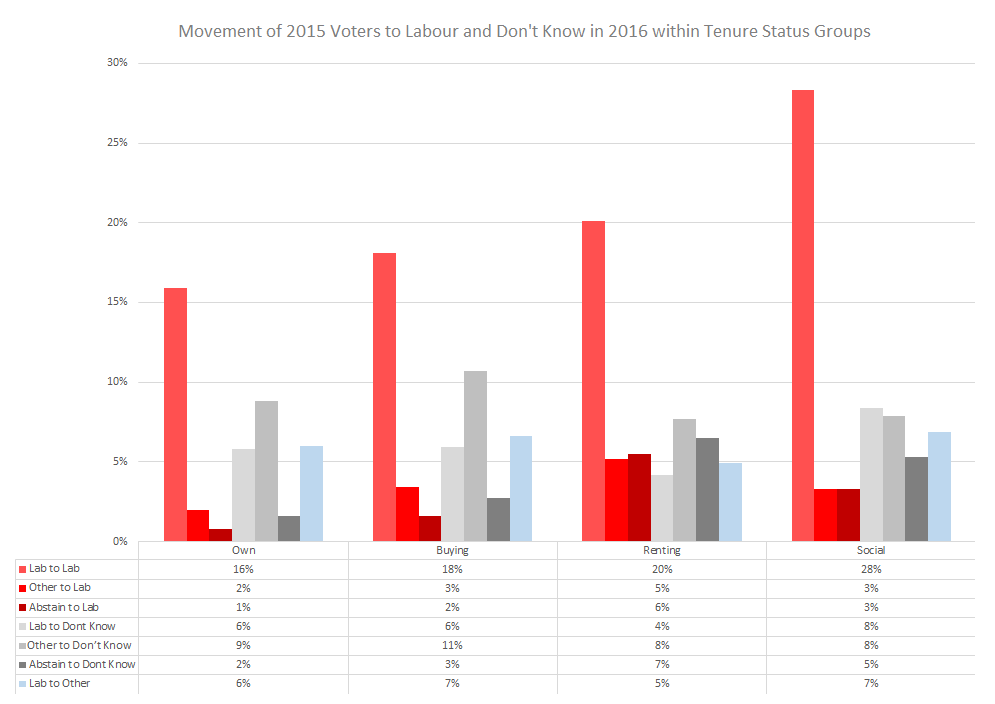
When the population is divided up by housing tenure, the movement between 2015 and 2016 follows the new emerging pattern of increased loyalty among those who appear to have low wealth. Importantly, the increase in the Labour voting intention among renters uniquely reflects the relatively high movement of non-voters and voters for other parties to Labour as well. Furthermore, although Labour had lost significantly among owner-occupiers and mortgage holders, a significant portion of this group were still unsure of how they would vote in 2016 rather than moving to other parties.
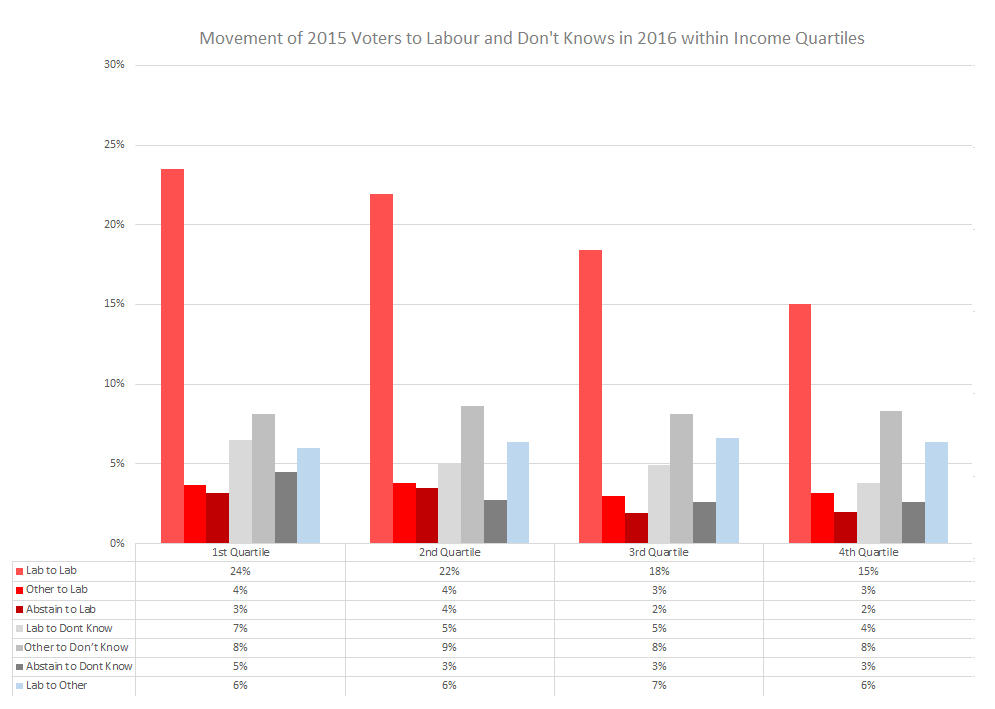
In contrast to housing tenure, the pattern across income groups is remarkably stable. In particular, loyalty across income groups to the Party remained remarkably similar to the patterns in 2015 with the emerging convergence between the 2nd and 1st income quartile occurring due to the higher movement of 1st quartile voters into don’t know. In turn, the emerging bifurcation between the first two income quartile and second two is driven by the low number of voters in the richer income quartiles moving to Labour from other parties or abstention.
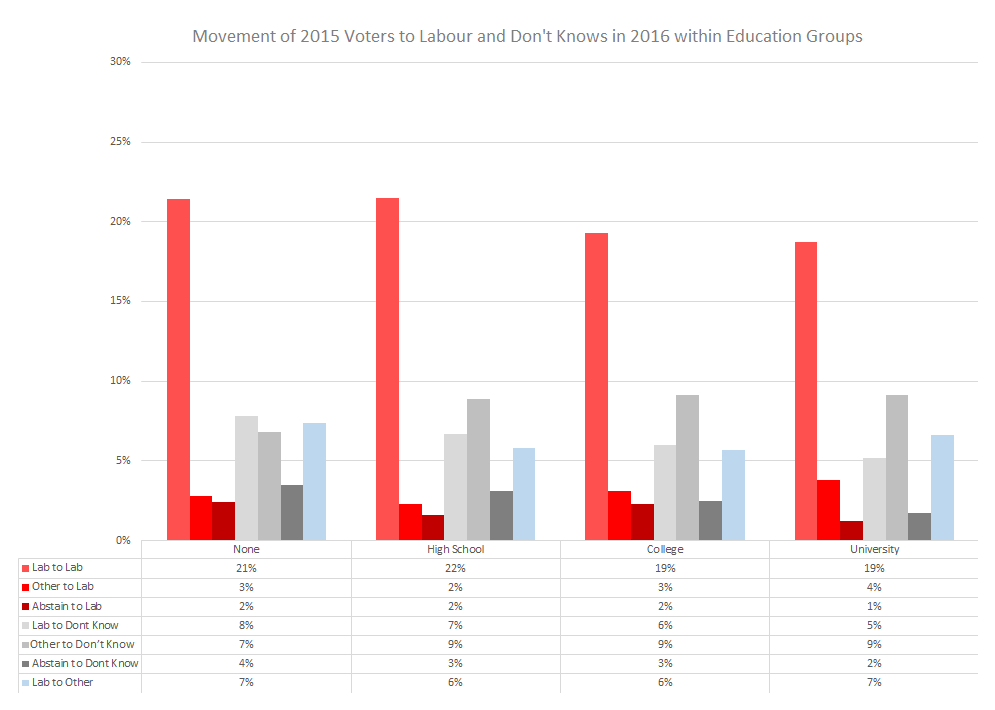
While above we saw a convergence of Labour’s support within each education group, the way this is constructed is slightly different across each group. Though only just, the largest share of movement to other parties occurs among those with university level and no education. Loyalty to Labour is highest among those in the low education categories, with those who are educated to high school level becoming stronger supporters than those with no education.
This secondary analysis partially confirms that the changing economic location of Labour voters is down to the emergence of new voters. This is especially relevant to the changing patterns around wealth, the increased bifurcation between population as divided by income, and also explains university-educated voters moving closer to those with lower levels of education. However, patterns of Party loyalty for existing voters were relatively similar to previous elections, with the major exception of those with the lowest levels of education who had moved substantially away from Labour.
Conclusions
Though I believe that this individual data does support the idea that Labour’s support base is changing, it remains unclear if this is providing it with the space for expansive future growth. In the individual data here, collected before the election, the sole category in which Labour had gained more voters from other parties than it has lost is renters. However, in the 2016 data there are a high number of don’t knows in numerous categories which Labour has lost; given YouGov data showed that Labour won in all non-retired categories in the election, this suggests that many of these people returned. It’s not currently clear what this means when so many had moved away from Labour before the election.
The geographical data indicates that while culturally working-class voters are becoming less important to Labour, it is not necessarily the case that Labour is losing the support of the “actual” working class as defined by economic location. Indeed, it increasingly seems capable of gaining lower income highly educated workers from other parties, most particularly among those with low wealth. This seems to be the foundation of a new coalition whose concerns would not easily be answered by a more centrist approach, as Ed Miliband demonstrated only two years ago.
Though this is only provisional until individual data for the 2017 election is released, it does suggest that the class coalition underpinning the Labour Party is beginning to change. Increasingly the Labour Party seems to be gaining support not from those who were “left behind” by globalisation—or at least British capitalism’s path of development from the 1970s until 2008—but those who were supposed to gain from globalisation but didn’t due to the crisis and its aftermath.
It is also worth noting that in my analysis of individual data I have not addressed an obvious confounding variable which may explain much of this variation; age. Young people are heavily associated with renting in the post-crisis era, make up a significant section of 1st and 2nd income quartile (as do pensioners), and furthermore may explain the movement of university educated individuals from other parties to Labour. However, this does assume that the traditional cohort effect of voters getting more conservative as they get older still holds, which may well not be the case anymore. The possibility that today’s young people will not necessarily become more Conservative as they age is rooted in changes in British capitalism, specifically increased prices of assets and the transformed function of assets that may exclude large numbers of today’s young people from the means by which their parents became wealthier as they aged.
Consequently, although we know that age has played a complex role in supporting Labour’s gains recently, the individual data tries to identify the economic location shared by individuals across age groups. Therefore excluding it does not challenge my argument that Labour has only lost the support of a specific section of the working class.
Instead it has allowed us to better identify what has occurred with the uneven effect of pay and working class support for Labour in 2017. The losses primarily seem to have occurred within a section of the C2DE social grades whose position in that occupation-based classification is a derivative of their education. This has resulted in net losses among those with no education and uneven losses in the 1st income quartile.
By identifying that even at a low point in polling in 2016 Labour maintained support in some key economic locations in the individual data, and gained among those with low wealth, we can begin to explain why focusing on economic location may be worthwhile as we move into an era in which class is no longer clearly defined by differences between occupations.